


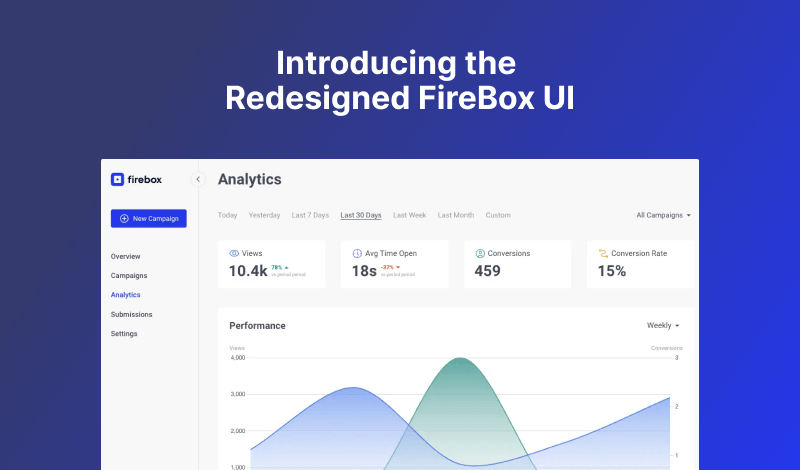
We’re super excited to bring a major design update to the FireBox UI!
A fresh and modern user interface, including in-depth campaign performance analytics and support for dark mode, is now available in our WordPress popup builder, FireBox. The revamped Analytics page now transforms raw data into actionable insights, presenting an array of metrics and dimensions to help you understand your campaign's performance effectively. With these improvements, FireBox empowers you to create more engaging WordPress popups and optimize your campaigns for success.

Let's dive into the key improvements and features you can expect in the new FireBox.
Modern and Clean UI
The first thing you'll notice with the new FireBox is its clean and modern user interface. We've put a great deal of effort into crafting a design that not only looks appealing but also streamlines your interaction with the plugin. The intuitive layout ensures that you can navigate through FireBox effortlessly.
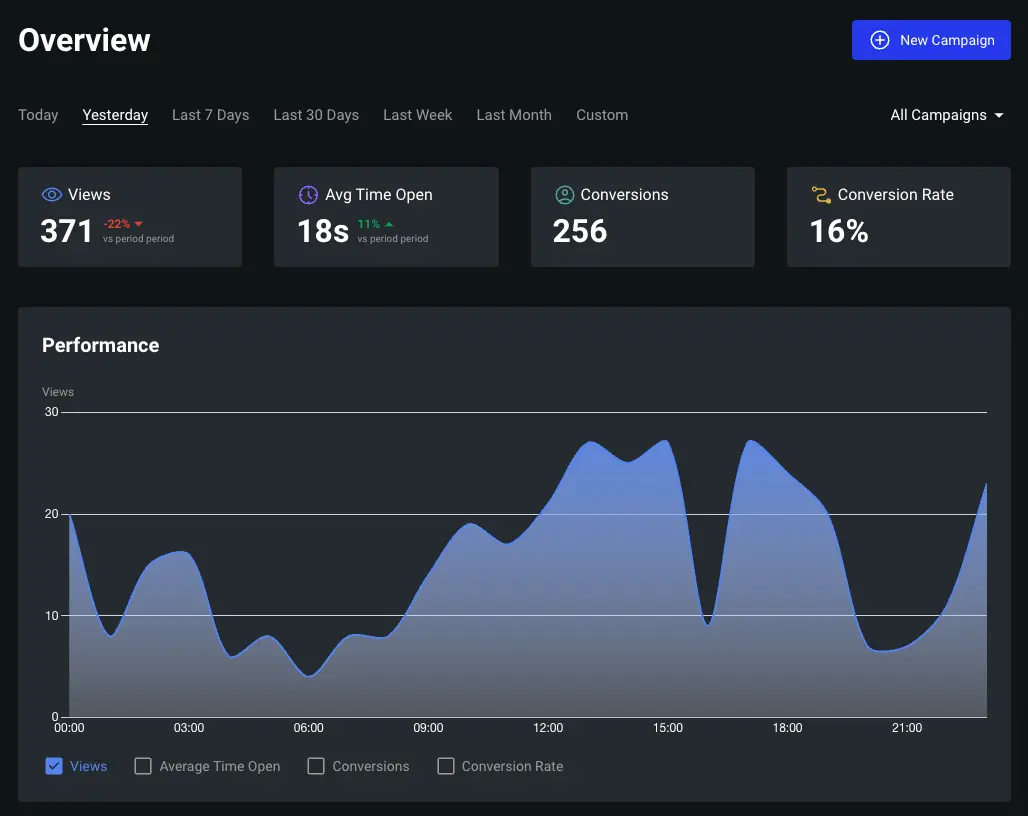
Dark Mode Support
We understand that many users prefer working in dark mode, and we've got you covered. FireBox now supports dark mode, making it easier on the eyes during those late-night work sessions or for anyone who appreciates a darker aesthetic.
Sidebar Quick Access Links
We've also added convenient links right within the interface's sidebar to provide you with easy access to essential resources:
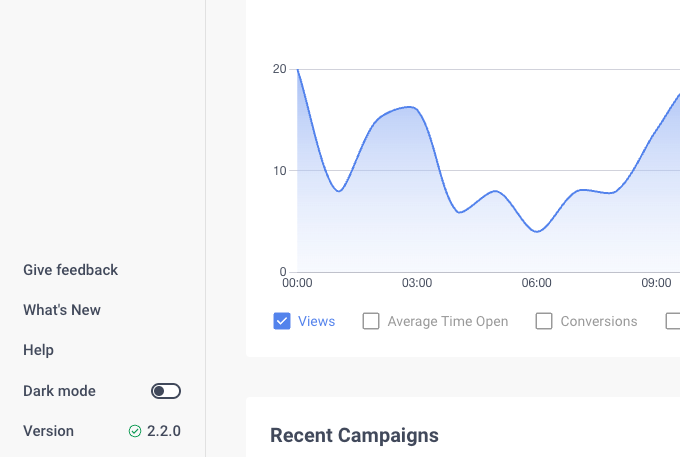
- Give Feedback: Your feedback is invaluable to us. Share your thoughts and suggestions, or report issues directly through this link.
- What's New: Stay updated on the latest changes, bug fixes, and improvements.
- Help: Consult our documentation and maximize FireBox's capabilities.
In addition, to keep you informed, FireBox now displays the current version prominently. This feature allows you to easily check if your plugin is up to date or if any updates are available. Staying up-to-date is crucial for security and accessing the latest features, and we've made the process more transparent than ever.
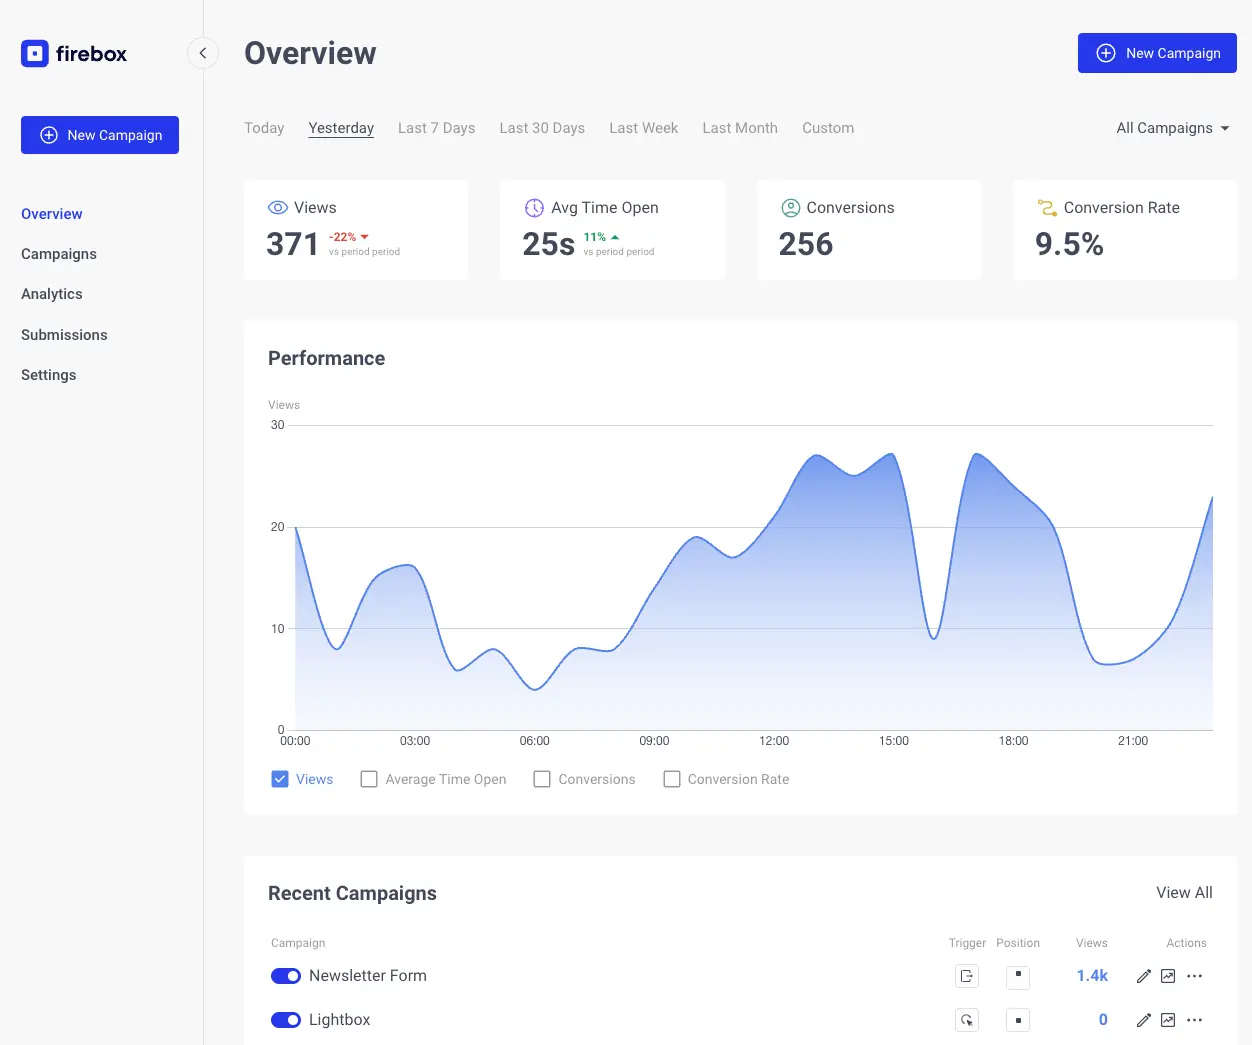
The Dashboard
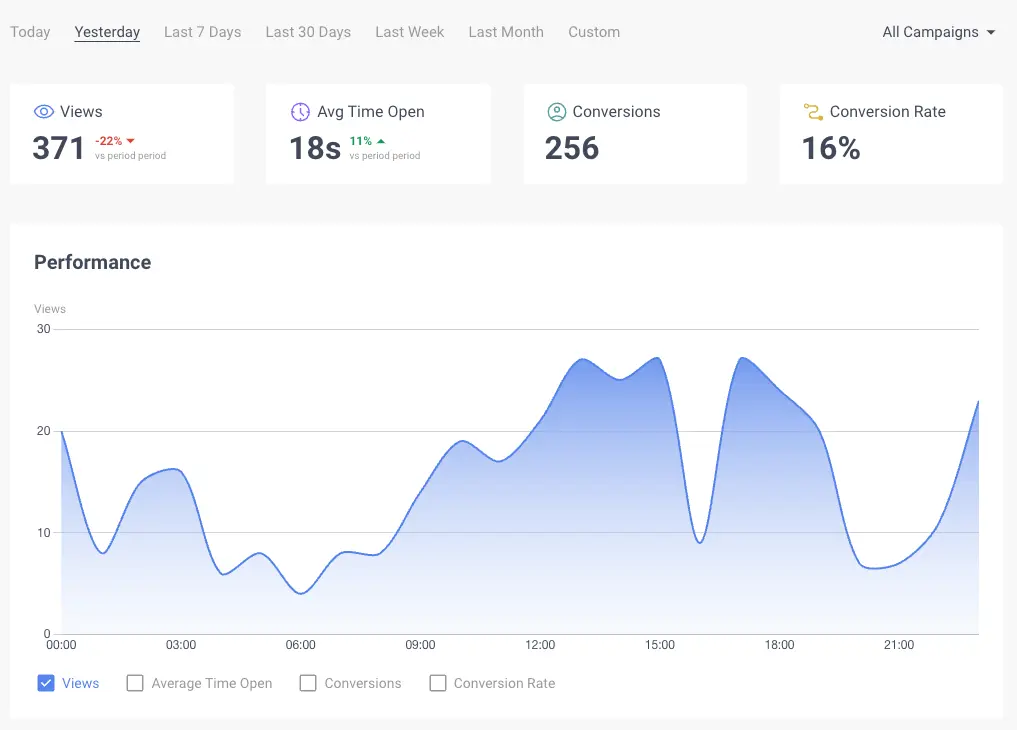
In the FireBox dashboard, you can now access a comprehensive view of your campaign performance. We've introduced period filters, allowing you to narrow down statistics to specific date ranges, such as "this week" or "last month." Furthermore, you can filter all statistics to focus on a specific campaign, giving you the flexibility to analyze performance with precision.
Beyond campaign performance information, FireBox now offers two additional cards below:
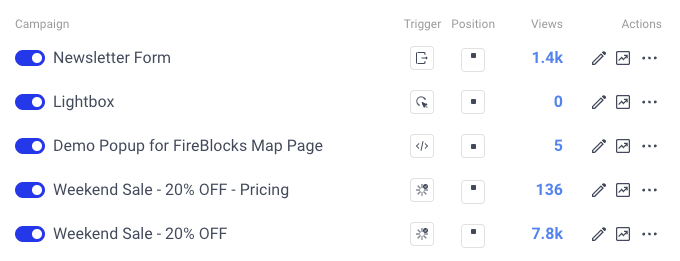
Featured Campaigns
This card overviews the five most recent campaigns you've created. It is a quick link to access more details about specific campaigns. You can easily activate or deactivate campaigns, view in-depth analytics, or even delete a campaign from this card. It's your shortcut to managing and fine-tuning your campaigns efficiently.
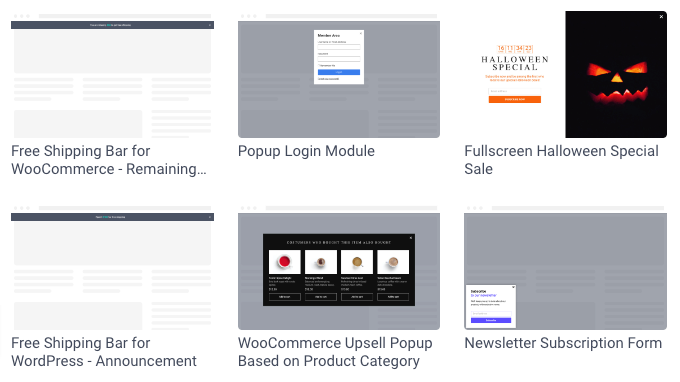
Trending Templates
FireBox now presents a card displaying six trending popup templates. These trends are calculated based on the "Inserts" of our users utilizing our popup library. By using these trending templates, you can stay ahead of the curve and create engaging popups that resonate with your audience. It's an excellent resource to boost your campaign's effectiveness and keep your website's user experience fresh and exciting.
Analytics Report
Understanding your campaign's performance is vital for making informed decisions. Let's look at the Analytics page where the magic happens. There, we transform raw data into actionable insights with a touch of marketing flair.
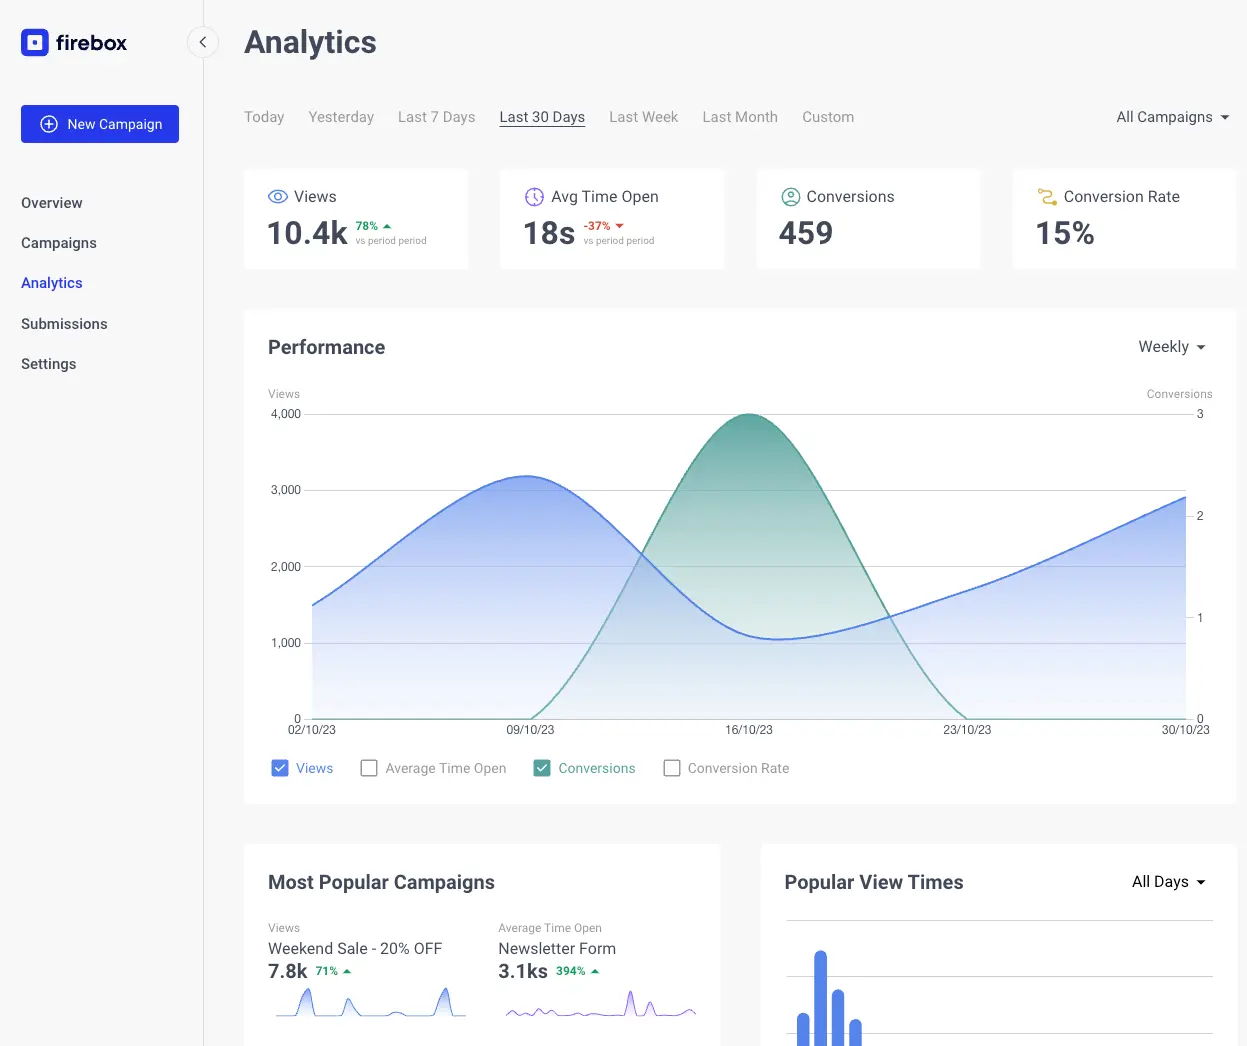
The campaign analytics report provides you with a bird's eye view of your FireBox campaigns' performance, along with detailed insights into individual campaigns. It's your ticket to understanding how your popups are engaging your audience and driving results.
Filters: Tailored Insights
Filters are your secret weapon for refining your analytics. You can utilize the Period and Campaign filters to drill down into specific timeframes and campaign performance. This allows you to focus on the data that matters most to you. Whether it's the last 7 days or a particular campaign, FireBox puts the power of customization in your hands.
Metrics: Quantifying Success
In the world of analytics, metrics are your best friends. FireBox provides a range of metrics that offer quantitative insights into your campaign's performance. These metrics include:
- Views: Understand how many times your campaign was displayed to users. Multiple views by the same person are counted. (Note: The Floating Button or teaser is not part of a view.)
- Conversions: A conversion is a visitor who completes your campaign's desired action, depending on your campaign type. Whether collecting email addresses or clicking on a call-to-action, conversions measure success.
- Conversion Rate: This metric reveals the percentage of visitors who completed the desired action out of those who viewed your campaign. A higher conversion rate signifies more effective campaigns.
- Average Time Open: Discover how long users keep your campaign open before closing it. This valuable insight can help you optimize your popup's timing.
Read more details about Metrics on our detailed documentation page.
Dimensions: A Deeper Understanding
Dimensions are attributes that provide context to your data. FireBox offers a variety of dimensions to help you segment and analyze user behavior, traffic sources, and demographics.
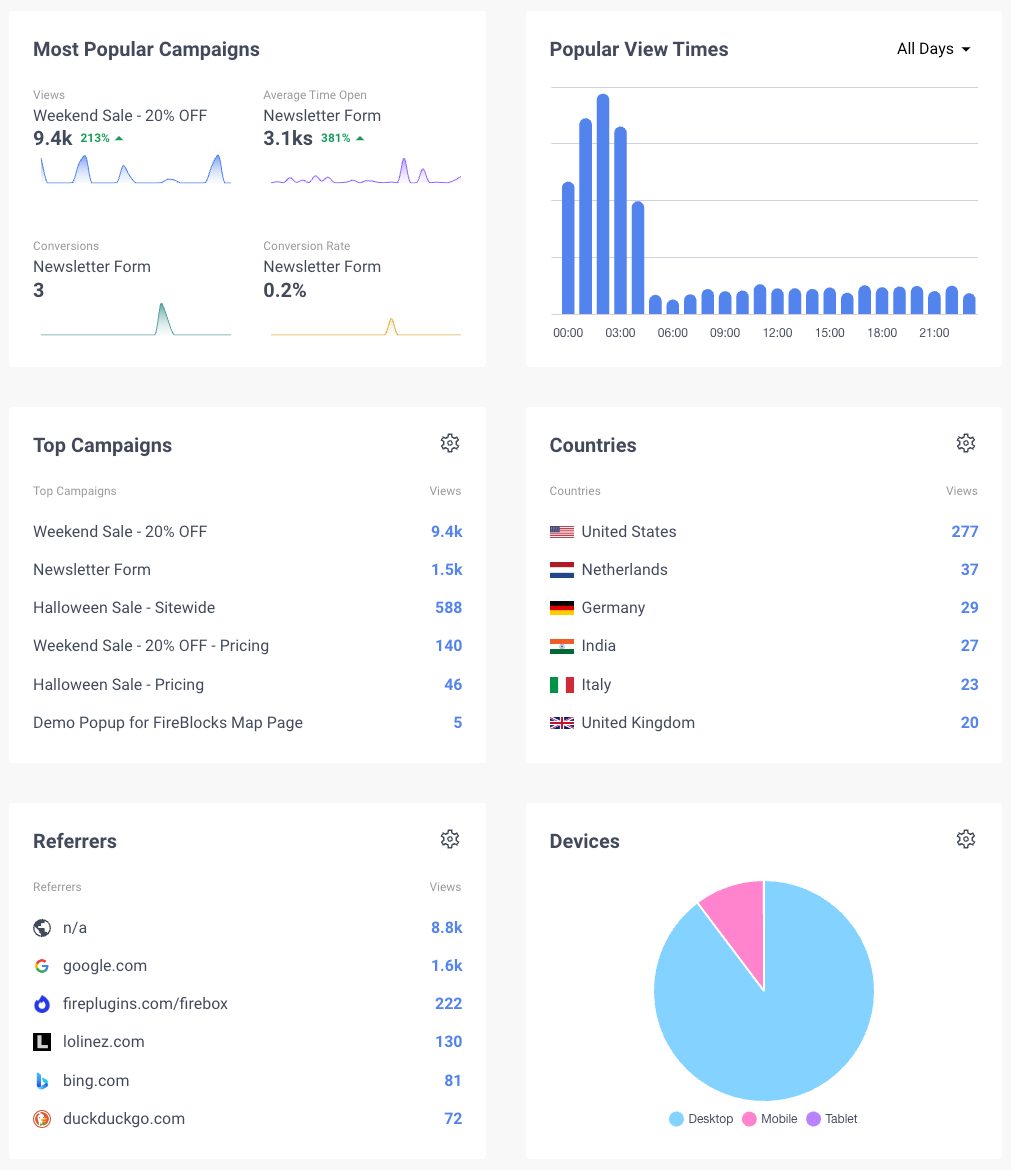
Here's a quick overview:
- Countries: Identify the geographical origin of user activity. Tailor your campaign content based on user location.
- Referrers: Understand where your traffic is coming from. This information is crucial for refining your marketing strategies.
- Devices: Analyze the type of device users are using to interact with your campaigns, optimizing their experience.
- Paths: Discover which pages on your website are most successful in converting visitors through your popups.
- View Hours: Learn when users are most active, allowing you to time your campaigns for maximum impact.
- Events: Track how often your campaign is opened and closed, gaining insights into user engagement.
- Conversions: Measure the success of your campaigns by keeping tabs on the number of user-triggered events.
With these dimensions, FireBox equips you with a complete understanding of how different user segments interact with your campaigns, enabling data-driven decisions for better performance.
Read more details about Dimensions on our detailed documentation page.
The Philosophy Behind This Redesign
This redesign is more than just a cosmetic upgrade. It's a substantial enhancement that elevates your WordPress popups campaign management experience with a sleek new design, powerful analytics, and user-friendly features.
The redesign of FireBox embodies a user-centric philosophy focused on three core principles:
- User-Centric Design: Our modern, intuitive interface ensures a seamless user experience, catering to traditional and Dark Mode preferences.
- Transparency and Accessibility: We prioritize transparency by prominently displaying version information, providing quick access links to resources, and encouraging user feedback.
- Efficiency and Customization: The revamped dashboard offers an efficient overview of campaign performance, while additional cards for featured campaigns and trending templates streamline campaign management, offering quick links for customization.
This philosophy aims to empower users, promote informed decision-making, and make FireBox a valuable partner in your success. Get ready to make your popups more effective and engaging. Explore the new interface, leverage the insightful analytics, and watch your campaigns thrive.
Get FireBox for Free
Enter your WordPress website URL to install instantly.
Trusted by 9,000+ users

0 Comments